imview
- imview(raster='', contour='', zoom='1', axes='', out='')[source]
View an image
[Description] [Examples] [Development] [Details]
- Parameters
- Description
Warning
There are Known Issues for imview.
Executing the imview task will bring up a display panel window, which can be resized. If no data file was specified, a Load Data window will also appear. Click on the desired data file and choose the display type; the rendered data should appear on the display panel.Images can be blinked, and movies are available for spectral-line image cubes.The loaded data and related display options can be saved in a ‘restore’ file for later use. You can provide the ‘restore’ filename on the command line or select it from the Load Data window.
A Data Display Options window will also appear. It has drop-down subsections for related options, most of which are self-explanatory. It is also possible to use the viewer GUI tool to perform image manipulation and analysis tasks that are not available from the command-line start.
The imview task provides access to a subset of all of the configuration options for loading and configuring the display of images in the casaviewer, but support for this task is limited. See the chapter pages on Image Cube Visualization for more information.
Parameter descriptions
There are five optional parameters for imview – raster, contour, zoom, axes, and out. Each of these parameters are optional, can take a few different forms, and are treated as python dictionaries:
raster
Raster filename (string) or complete raster config dictionary. The allowed dictionary keys are:
file (string) => image file to open
scaling (float) => scaling power cycles
range (float*2) => data range
colormap (string) => name of colormap
colorwedge (bool) => show color wedge?
contour
Contour filename (string) or complete contour config dictionary. The allowed dictionary keys are:
file (string) => file to load
levels (float*N) => relative levels
base (numeric) => zero in relative levels
unit (numeric) => one in the relative levels
zoom
Zoom can specify incremental zoom (integer), zoom region read from a file (string), or dictionary specifying the zoom region. The dictionary can have different forms. It can be a simple region specified with blc (2 element vector) and trc (2 element vector), along with an optional coord key (“pixel” or “world”; pixel is the default), or it can be a complete region rectangle, e.g., loaded with rg.fromfiletorecord ( ). The dictionary can also contain a channel (integer) field which indicates which channel should be displayed.
(int) integral zoom level
(string) region file to load as the zoom region
(dict) blc (numeric*2) => bottom left corner
trc (numeric*2) => top right corner
coord (string) => pixel or world
channel (int) => chanel to display
(dict) <region record> => record loaded, e.g., rg.fromfiletorecord ( )
axes
This can either be a three-element vector (string) where each element describes what should be found on each of the x, y, and z axes, or a dictionary containing fields “x”, “y” and “z” (string):
(dict) x => dimension for x-axes
y => dimension for y-axes
z => dimension for z-axes
out
Output filename or complete output config dictionary. If a string is passed, the file extension is used to determine the output type (jpg, pdf, eps, ps, png, xbm, xpm, or ppm). If a dictionary is passed, it can contain the fields, file (string), scale (float), dpi (int), or orient (landscape or portrait). The scale field is used for the bitmap formats (i.e., not ps or pdf) and the dpi parameter is used for scalable formats (pdf or ps).
(dict) file (string) => filename
format (string) => valid ext (filename ext overrides)
scale (numeric) => scale for non-eps, non-ps output
dpi (numeric) => dpi for eps or ps output
orient (string) => portrait or landscape
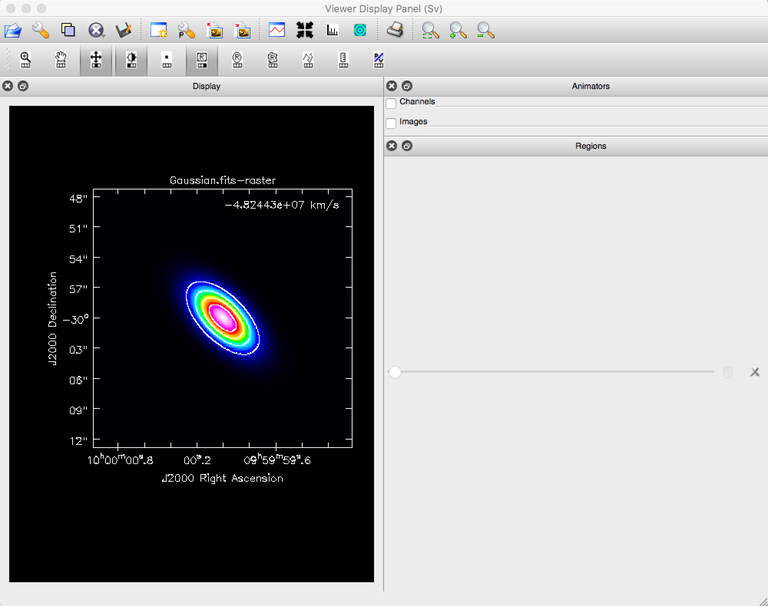
imview interactive display
- Examples
To simply create a CASA viewer to set up interactively, you can use:
imviewTo open a particular image:
imview "ngc5921.clean.image"
To open an image and overlay a contour:
imview "ngc5921.clean.image", "ngc5921.clean.image"
or equivalently:
imview(raster="ngc5921.clean.image",
       contour="ngc5921.clean.image")
To output an image:
imview(raster="ngc5921.clean.image", out="ngc5921-01.png")
To plot a subset (zoom) of a raster image, noting the notation of curly brackets:
imview(raster="ngc5921.clean.image", out="ngc5921-02.png",
       zoom={'channel': 10, 'blc': [113,109], 'trc': [141,136]} )
To make an overlay of a raster image (ngc5921.clean.image) with a contour map of the same image (ngc5921.clean.image). Data ranges, the colormap, and the scaling cycles of the raster image are selected. Contours are auto-generated, and the x-axis will be declination. The image is written out to a file named myout.png (in png format).
imview(raster={'file': 'ngc5921.clean.image', 'range': [-0.01,0.03],
               'colormap': 'Hot Metal 2', 'scaling': -1},
       contour={'file': 'ngc5921.clean.image'},
       axes={'x':'Declination'}, zoom={'channel': 7, 'blc': [75,75],
             'trc': [175,175], 'coord': 'pixel'},
       out='myout.png')
Same as the previous example, but with an integral zoom level and no output to a file:
imview(raster={'file': 'ngc5921.clean.image', 'range': [-0.01,0.03],
               'colormap': 'Hot Metal 2'},
       contour={'file': 'ngc5921.clean.image'},
       axes={'x':'Declination'},
       zoom=2)
Here, the contour levels are explicitely given, and a region file is used to define the zoom area:
imview(raster={'file': 'ngc5921.clean.image', 'range': [-0.01,0.03],
               'colormap': 'Hot Metal 2'},
       contour={'file': 'ngc5921.clean.image', 'levels': [-0.2, 0.2, 0.25, 0.3, 0.35, 0.4, 0.6, 0.8] },
       zoom='myregion.rgn')
Specifying zoom={‘file’: ‘myregion.rgn’, ‘channel’: 10} would result in the same level of zoom and would display channel number 10 from the cube.
- Development
No additional development details
- Parameter Details
Detailed descriptions of each function parameter
raster ({string, record}='')- (Optional) Raster filename (string) or complete raster config dictionary. The allowed dictionary keys are file (string), scaling (numeric), range (2 element numeric vector), colormap (string), and colorwedge (bool).contour ({string, record}='')- (Optional) Contour filename (string) or complete contour config dictionary. The allowed dictionary keys are file (string), levels (numeric vector), unit (float), and base (float).zoom ({int, string, record}='1')- (Optional) zoom can specify intermental zoom (integer), zoom region read from a file (string) or dictionary specifying the zoom region. The dictionary can have two forms. It can be either a simple region specified with blc (2 element vector) and trc (2 element vector) [along with an optional coord key (“pixel” or “world”; pixel is the default) or a complete region rectangle e.g. loaded with “rg.fromfiletorecord( )”. The dictionary can also contain a channel (integer) field which indicates which channel should be displayed.axes ({string, record}='')- (Optional) this can either be a three element vector (string) where each element describes what should be found on each of the x, y, and z axes or a dictionary containing fields “x”, “y” and “z” (string).out ({string, record}='')- (Optional) Output filename or complete output config dictionary. If a string is passed, the file extension is used to determine the output type (jpg, pdf, eps, ps, png, xbm, xpm, or ppm). If a dictionary is passed, it can contain the fields, file (string), scale (float), dpi (int), or orient (landscape or portrait). The scale field is used for the bitmap formats (i.e. not ps or pdf) and the dpi parameter is used for scalable formats (pdf or ps).