Open in Colab: https://colab.research.google.com/github/casangi/examples/blob/master/community/casa6_demo.ipynb
Modular CASA Demo
Original Author: rraba@nrao.edu
Description
This notebook shows how to install the modular CASA 6 packages with some basic orientation:
locate the casadata folder
list the available tasks
find and print the log file
run a simple tclean command
view the output images with Astropy
view the output images with CARTA
WARNING: when running this Notebook in Google Colab, CASA pip-wheel occasionally experience incompatibilities with recently upgraded Colab environments. Please check the Known Issues Section in CASA Docs when experiencing installation problems, or contact the CASA team at casa-feedback_at_nrao.edu
Installation
First the system must be configured with the appropriate pre-requisite libraries to create a virtual display necessary for later plots/images.
[ ]:
# prerequisite system setup
import os
os.system('apt-get install xvfb')
os.system('pip install pyvirtualdisplay')

from pyvirtualdisplay import Display
display = Display(visible=0,size=(1024,768))
display.start( )

print('completed system setup')
completed system setup
Then we can choose from the available CASA packages to install: casatools, casatasks, casaplotms, casaviewer, almatasks, casampi, casashell, casadata, casampi, casaplotserver
The pip installer generally handles dependencies automatically (for example casatasks needs casatools), however casadata is the exception that must be explicitly installed and updated by the user.
[ ]:
import os
print("installing casa packages...\n")
os.system("pip install casatasks==6.3.0.48")
os.system("pip install casaviewer==1.2.14")
os.system("pip install casadata")

print("downloading MeasurementSet from CASAguide First Look at Imaging...\n")
os.system("wget https://bulk.cv.nrao.edu/almadata/public/working/sis14_twhya_calibrated_flagged.ms.tar")
os.system("tar -xvf sis14_twhya_calibrated_flagged.ms.tar")

print("make a config file for Google Colab...\n")
!mkdir ~/.casa
!echo "home     = '/content/'" > ~/.casa/config.py
!echo "datapath = ['`find / -type d -name casadata`']" >> ~/.casa/config.py
!more ~/.casa/config.py
installing casa packages...

downloading MeasurementSet from CASAguide First Look at Imaging...

make a config file for Google Colab...

home     = '/content/'
datapath = ['/usr/local/lib/python3.7/dist-packages/casadata']
Getting Started
We can inspect the contents of a package, or better yet, read its corresponding API section in CASAdocs
[ ]:
import casatasks
casatasks.__all__
['casalog',
 'version',
 'version_string',
 'imhead',
 'immoments',
 'imhistory',
 'applycal',
 'bandpass',
 'blcal',
 'calstat',
 'concat',
 'split',
 'listobs',
 'flagdata',
 'flagcmd',
 'setjy',
 'cvel',
 'cvel2',
 'importuvfits',
 'importfits',
 'exportfits',
 'exportuvfits',
 'partition',
 'listpartition',
 'flagmanager',
 'mstransform',
 'tclean',
 'immath',
 'vishead',
 'uvsub',
 'spxfit',
 'splattotable',
 'specsmooth',
 'specflux',
 'smoothcal',
 'specfit',
 'imstat',
 'slsearch',
 'delmod',
 'imsubimage',
 'accor',
 'asdmsummary',
 'clearcal',
 'conjugatevis',
 'exportasdm',
 'importasdm',
 'clearstat',
 'fixplanets',
 'fixvis',
 'phaseshift',
 'fluxscale',
 'ft',
 'gaincal',
 'gencal',
 'uvcontsub3',
 'testconcat',
 'apparentsens',
 'hanningsmooth',
 'imcollapse',
 'imcontsub',
 'imdev',
 'imfit',
 'impbcor',
 'importasap',
 'importatca',
 'importfitsidi',
 'importgmrt',
 'importnro',
 'importvla',
 'impv',
 'imrebin',
 'imreframe',
 'imregrid',
 'imsmooth',
 'imtrans',
 'imval',
 'initweights',
 'listcal',
 'listfits',
 'listhistory',
 'listsdm',
 'listvis',
 'makemask',
 'polcal',
 'polfromgain',
 'predictcomp',
 'rerefant',
 'rmfit',
 'rmtables',
 'sdatmcor',
 'sdbaseline',
 'sdcal',
 'sdfit',
 'sdfixscan',
 'sdgaincal',
 'sdimaging',
 'sdsmooth',
 'tsdimaging',
 'nrobeamaverage',
 'sdtimeaverage',
 'simanalyze',
 'simobserve',
 'feather',
 'simalma',
 'statwt',
 'virtualconcat',
 'uvcontsub',
 'uvmodelfit',
 'visstat',
 'widebandpbcor',
 'importmiriad',
 'plotweather',
 'plotants',
 'fringefit',
 'plotbandpass',
 'sdintimaging',
 'sdpolaverage',
 'sdsidebandsplit',
 'plotprofilemap']
We execute tasks just like normal Python functions. Many times they will write information to the log or a specified output file, which we then must display.
[ ]:
from casatasks import listobs

rc = listobs(vis='sis14_twhya_calibrated_flagged.ms', listfile='obslist.txt', verbose=False, overwrite=True)
!cat obslist.txt
================================================================================
           MeasurementSet Name:  /content/sis14_twhya_calibrated_flagged.ms      MS Version 2
================================================================================
   Observer: cqi     Project: uid://A002/X327408/X6f
Observation: ALMA(26 antennas)
Data records: 80563       Total elapsed time = 5647.68 seconds
   Observed from   19-Nov-2012/07:36:57.0   to   19-Nov-2012/09:11:04.7 (UTC)

Fields: 5
  ID   Code Name                RA               Decl           Epoch   SrcId      nRows
  0    none J0522-364           05:22:57.984648 -36.27.30.85128 J2000   0           4200
  2    none Ceres               06:10:15.950590 +23.22.06.90668 J2000   2           3800
  3    none J1037-295           10:37:16.079736 -29.34.02.81316 J2000   3          16000
  5    none TW Hya              11:01:51.796000 -34.42.17.36600 J2000   4          53161
  6    none 3c279               12:56:11.166576 -05.47.21.52464 J2000   5           3402
Spectral Windows:  (1 unique spectral windows and 1 unique polarization setups)
  SpwID  Name                           #Chans   Frame   Ch0(MHz)  ChanWid(kHz)  TotBW(kHz) CtrFreq(MHz) BBC Num  Corrs
  0      ALMA_RB_07#BB_2#SW-01#FULL_RES    384   TOPO  372533.086       610.352    234375.0 372649.9688        2  XX  YY
Antennas: 21 'name'='station'
   ID=   1-4: 'DA42'='A050', 'DA44'='A068', 'DA45'='A070', 'DA46'='A067',
   ID=   5-9: 'DA48'='A046', 'DA49'='A029', 'DA50'='A045', 'DV02'='A077',
   ID= 10-15: 'DV05'='A082', 'DV06'='A037', 'DV08'='A021', 'DV10'='A071',
   ID= 16-19: 'DV13'='A072', 'DV15'='A074', 'DV16'='A069', 'DV17'='A138',
   ID= 20-24: 'DV18'='A053', 'DV19'='A008', 'DV20'='A020', 'DV22'='A011',
   ID= 25-25: 'DV23'='A007'
Another example, lets do channel averaging with MSTransform. Here we need to make sure we’ve deleted the previous output file if/when running multiple times. Since this task doesn’t return anything, we can look at the end of the log file to see what happened.
[ ]:
from casatasks import mstransform

os.system("rm -fr chanavg.ms")
mstransform(vis='sis14_twhya_calibrated_flagged.ms', outputvis='chanavg.ms',
            datacolumn='DATA', chanaverage=True, chanbin=3)
!tail casa-202*.log
2021-10-14 17:43:24     INFO    MSTransformManager::parseMsSpecParams   Tile shape is [0]
2021-10-14 17:43:24     INFO    MSTransformManager::parseChanAvgParams  Channel average is activated
2021-10-14 17:43:24     INFO    MSTransformManager::parseChanAvgParams  Channel bin is [3]
2021-10-14 17:43:24     INFO    MSTransformManager::colCheckInfo        Adding DATA column to output MS from input DATA column
2021-10-14 17:43:24     INFO    MSTransformManager::open        Select data
2021-10-14 17:43:24     INFO    MSTransformManager::createOutputMSStructure     Create output MS structure
2021-10-14 17:43:24     INFO    ParallelDataHelper::::casa      Apply the transformations
2021-10-14 17:43:29     INFO    mstransform::::casa     Task mstransform complete. Start time: 2021-10-14 17:43:23.610120 End time: 2021-10-14 17:43:29.323998
2021-10-14 17:43:29     INFO    mstransform::::casa     ##### End Task: mstransform          #####
2021-10-14 17:43:29     INFO    mstransform::::casa     ##########################################
Running tclean
Tclean works in non-interactive mode only (interactive=False).
[ ]:
from casatasks import tclean

print("running tclean, may take a bit...")

tclean(vis='sis14_twhya_calibrated_flagged.ms', imagename='first_image',
       field='5', spw='', specmode='mfs', deconvolver='hogbom', nterms=1,
       gridder='standard', imsize=[250,250], cell=['0.1arcsec'],
       weighting='natural', threshold='0mJy', niter=5000,
       interactive=False, savemodel='modelcolumn')

print("complete")
running tclean, may take a bit...
complete
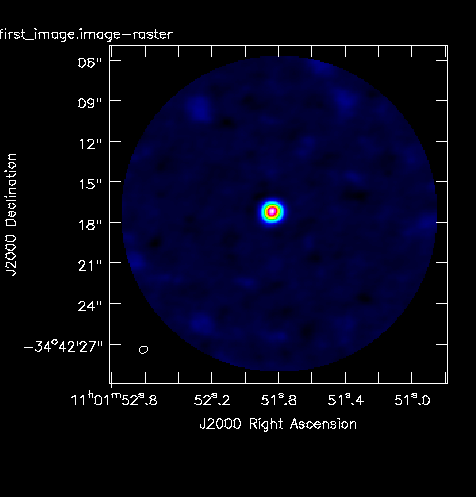
View Images with Viewer
We can use the casaviewer package to view images, but we need to start the viewer manually as a separate process
[ ]:
import subprocess as sp

sp.Popen('/usr/local/lib/python3.7/dist-packages/casaviewer/__bin__/casaviewer-x86_64.AppImage',
         shell=True, preexec_fn=os.setsid, stdin=sp.PIPE, stdout=sp.PIPE, stderr=sp.STDOUT)
<subprocess.Popen at 0x7fb797158190>
Now call imview and render the image to an output file where it can then be displayed
[ ]:
from casaviewer import imview
from IPython.display import Image

imview('first_image.image', out='test.png')

Image(filename="test.png")
(0) waiting for viewer process...
(1) waiting for viewer process...
(2) waiting for viewer process...
(3) waiting for viewer process...
(4) waiting for viewer process...
        ...{'id': 'casaviewer:b1fc', 'priority': 0, 'types': array(['shutdown', 'image-view', 'interactive-clean'], dtype='<U18'), 'uri': '0.0.0.0:44403'}
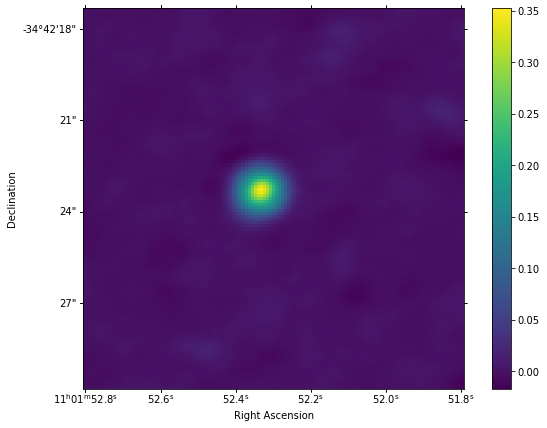
View Images with Astropy
We can use the image tool from casatools to load raw image data, then feed it to another Python package like Astropy and display it using Matplotlib.
Astropy is already installed in Google Colaboratory, but if running this on some other Jupyter Hub system, you’ll probably need to pip install astropy. Also note that we didn’t explicitly install casatools either, but it was automatically installed as a dependency of casatasks.
[ ]:
from casatools import image as IA
from astropy.wcs import WCS
import matplotlib.pyplot as plt
import numpy as np

ia = IA()
ia.open('first_image.image')
pix = ia.getchunk()[:,:,0,0]
csys = ia.coordsys()
ia.close()

rad_to_deg =  180/np.pi
w = WCS(naxis=2)
w.wcs.crpix = csys.referencepixel()['numeric'][0:2]
w.wcs.cdelt = csys.increment()['numeric'][0:2]*rad_to_deg
w.wcs.crval = csys.referencevalue()['numeric'][0:2]*rad_to_deg
w.wcs.ctype = ['RA---SIN', 'DEC--SIN']

plt.subplots(1,1, figsize=(10,7))
ax = plt.subplot(1, 1, 1, projection=w)
p1 = int(pix.shape[0]*0.25)
p2 = int(pix.shape[0]*0.75)

im = ax.imshow(pix[p1:p2,p1:p2].transpose(), origin='lower',  cmap=plt.cm.viridis)
plt.colorbar(im, ax=ax)
ax.set_xlabel('Right Ascension')
ax.set_ylabel('Declination')