viewer
-
viewer(infile, displaytype='raster', channel=0, zoom=1, outfile='', outscale=1.0, outdpi=300, outformat='jpg', outlandscape=False, gui=True)[source]¶ View an image or visibility data set
[Description] [Examples] [Development] [Details]
- Parameters
infile (string) - (Optional) Name of file to visualize.
displaytype (string=’raster’) - (Optional) Type of visual rendering (raster, contour, vector or marker). lel if an lel expression is given for infile (advanced).
channel (int=0) - (Optional) access a specific channel in the image cube
zoom (int=1) - (Optional) zoom in/out by increments
outfile (string=’’) - (Optional) name of the output file to generate
outscale (double=1.0) - (Optional) amount to scale output bitmap formats (non-PS, non-PDF)
outdpi (int=300) - (Optional) output DPI for PS/PDF
outformat (string=’jpg’) - (Optional) format of the output e.g. jpg or pdf (this is overridden by the output files extension
outlandscape (bool=False) - (Optional) should the output mode be landscape (PS or PDF)
gui (bool=True) - (Optional) Display the panel in a GUI.
- Description
The VIEWER task is deprecated in lieu of IMVIEW and MSVIEW, which contain the exact same functionality. Please invoke the imview (msview) task for visualizing images or image cubes (visibility data).
The viewer will display images in raster, contour, vector or marker form. Images can be blinked, and movies are available for spectral-line image cubes. For MeasurementSets, many display and editing options are available.
The viewer can be run by typing viewer within CASA, or casaviewer outside of CASA. Executing viewer will bring up a display panel window, which can be resized. If no data file was specified, a Load Data window will also appear. Click on the desired data file and choose the display type; the rendered data should appear on the display panel. A Data Display Options window will also appear. It has drop-down subsections for related options, most of which are self-explanatory.
The loaded data and related display options can be saved in a ‘restore’ file for later use. You can provide the restore filename on the command line or select it from the Load Data window.
See the Image Cube Visualization and Data Examination and Editing chapters in CASAdocs for (many) more details on using the viewer to display images and MSes.
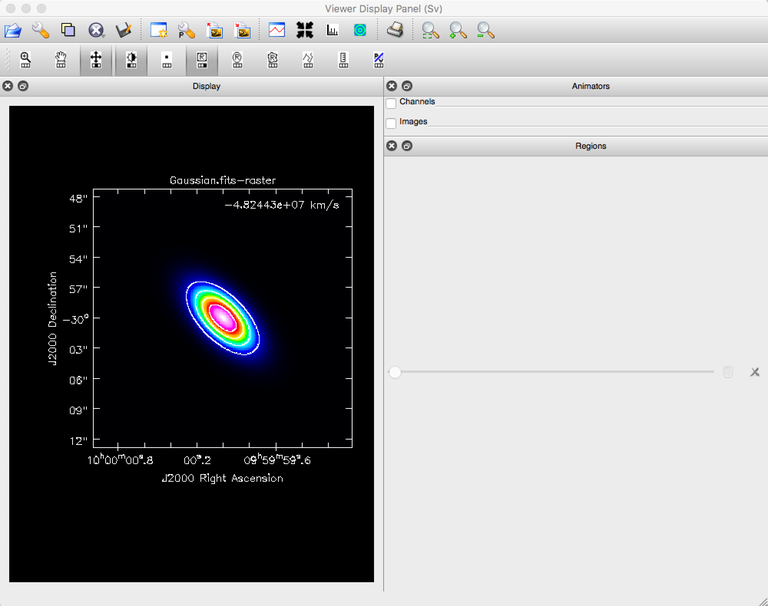
The CASA viewer
- Examples
To simply create a CASA viewer to set up interactively, you can type within CASA:
viewerTo open an image:
viewer "myimage.im"
To open a MeasurementSet:
viewer "mymeasurementset.ms"
To open an image and overlay a contour:
viewer "myimage.im", "contour"
To open a previously saved state of the viewer:
viewer "myrestorefile.rstr"
- Development
No additional development details
- Parameter Details
Detailed descriptions of each function parameter
infile (string)- (Optional) Name of file to visualize.displaytype (string='raster')- (Optional) Type of visual rendering (raster, contour, vector or marker). lel if an lel expression is given for infile (advanced).channel (int=0)- (Optional) access a specific channel in the image cubezoom (int=1)- (Optional) zoom in/out by incrementsoutfile (string='')- (Optional) name of the output file to generateoutscale (double=1.0)- (Optional) amount to scale output bitmap formats (non-PS, non-PDF)outdpi (int=300)- (Optional) output DPI for PS/PDFoutformat (string='jpg')- (Optional) format of the output e.g. jpg or pdf (this is overridden by the output files extensionoutlandscape (bool=False)- (Optional) should the output mode be landscape (PS or PDF)gui (bool=True)- (Optional) Display the panel in a GUI.