plotants
-
plotants(vis, figfile='', antindex=False, logpos=False, exclude='', checkbaselines=False, title='', showgui=True)[source]¶ Plot the antenna distribution in the local reference frame:
[Description] [Examples] [Development] [Details]
- Parameters
vis (path) - Name of input visibility file (MS)
figfile (string=’’) - Save the plotted figure to this file
antindex (bool=False) - Label antennas with name and antenna ID
logpos (bool=False) - Whether to plot logarithmic positions
exclude (string=’’) - Antenna name/id selection to exclude from plot
checkbaselines (bool=False) - Whether to check baselines in the main table.
title (string=’’) - Title for the plot
showgui (bool=True) - Show plot on gui.
- Description
This task is a simple plotting interface to produce plots of the antenna positions at the time that the data were taken. The antenna positions are taken from the ANTENNA sub-table of a MeasurementSet and are given in the local reference frame. The antennas are plotted Y vs. X in meters, where Y is toward local north and X is toward local east. The name of each antenna, and its ID when requested, is shown next to its respective location.
Interactive display
The antennas will be plotted in a plotter window as shown below. Tool buttons allow you to interactively pan, zoom, stretch, compress, or save the plot, as well as return to the original plot view (home) or navigate between previous plot views (forward and back).
Task parameters
When using plotants, you must specify the MeasurementSet to plot (vis parameter). The plot can be exported by specifying figfile=’plot_name.extension’. Supported format extensions for the figfile depend on which python modules are installed on your system, but may include: emf, eps, pdf, png, ps, raw, rgba, svg, and svgz. Formats currently available in a downloaded CASA package include all but emf (enhanced metafile).
Other parameter options allow the user to include the antenna ID with the name (antindex=True), to plot logarithmic positions (logpos=True), to exclude an antenna selection (e.g. exclude=”5~7” to exclude antenna IDs 5, 6, and 7), to plot only those antennas which appear in the MAIN table (checkbaselines=True), and to set the title to a specified string.
By default, the plotants GUI will be shown. When it is not needed, as in scripting mode to produce a figfile, set the showgui parameter to False. The default setting showgui=True will be overridden by the casa flags –nogui, –pipeline, and –agg, which suppress GUI tools.
For more information and sample plots, see the Chapter Pages on “Plotting Antenna Positions”.
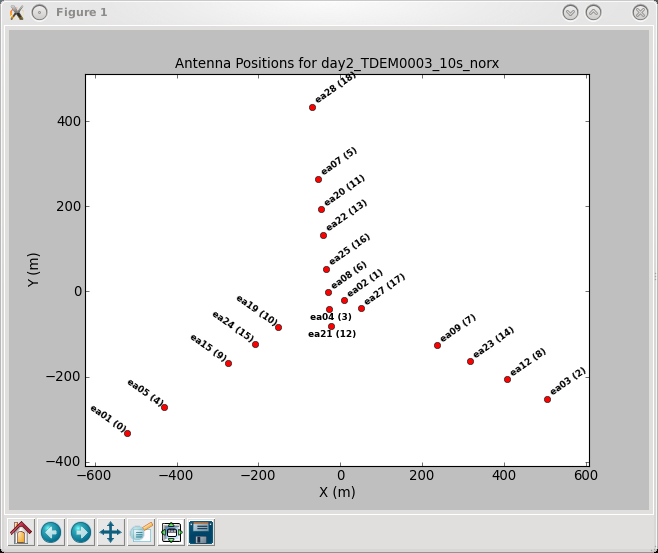
The plotants GUI for a VLA dataset, with antindex=True. Tool buttons allow the user to manipulate and export the plot.
- Examples
Plot antenna positions and make a plot in a ps-file:
# In CASA
plotants(vis='ngc5921.ms', figfile='ngc5921ants.ps')
Plot logarithmic positions of antennas in main table, labeled with antenna ID:
plotants(vis='ngc5921.ms', antindex=True, logpos=True,
         checkbaselines=True)
Plot antenna positions but exclude antennas 1, 2, 3, 5, and 7:
plotants(vis='ngc5921.ms', exclude='1~3,5,7')
- Development
No additional development details
- Parameter Details
Detailed descriptions of each function parameter
vis (path)- Name of input visibility file (MS)figfile (string='')- Save the plotted figure to this fileantindex (bool=False)- Label antennas with name and antenna IDlogpos (bool=False)- Whether to plot logarithmic positionsexclude (string='')- Antenna name/id selection to exclude from plotcheckbaselines (bool=False)- Whether to check baselines in the main table.title (string='')- Title for the plotshowgui (bool=True)- Show plot on gui.