plotprofilemap
- plotprofilemap(imagename, figfile='', overwrite=False, transparent=False, pol=0, spectralaxis='', restfreq='', plotrange='', title='', linecolor='b', linestyle='-', linewidth=0.2, separatepanel=True, plotmasked='empty', maskedcolor='gray', showaxislabel=False, showtick=False, showticklabel=False, figsize='', numpanels='')[source]
Makes profile map
[Description] [Examples] [Development] [Details]
- Parameters
imagename (path) - Input image name (CASA image or FITS)
figfile (string=’’) - Output figure name
figfile != ''
overwrite (bool=False) - Overwrite existing figfile
transparent (bool=False) - Output transparent figure
pol (int=0) - Polarization component to be plotted
spectralaxis (string=’’) - Type of spectral axis
spectralaxis = velocity
restfreq (string=’’) - Rest frequency
plotrange (string=’’) - Spectral axis range to plot
title (string=’’) - Title of the plot
linecolor (string=’b’) - Line color
linestyle (string=’-’) - Line style
linewidth (double=0.2) - Line width in points
separatepanel (bool=True) - Separate plots
plotmasked (string=’empty’) - Masked data handling
plotmasked = plot
maskedcolor (string=’gray’) - Line color for masked data
plotmasked = zero
maskedcolor (string=’gray’) - Line color for masked data
showaxislabel (bool=False) - Show axis labels on the bottom left panel
showtick (bool=False) - Show axis ticks
showtick = True
showticklabel (bool=False) - Show axis tick labels on the bottom left panel
figsize (string=’’) - Size of the figure
numpanels (string=’’) - Number of panels
- Description
Warning
There are Known Issues for plotprofilemap.
The plotprofilemap makes a spectral profile map from a specified image. The task accepts both a CASA image or a FITS cube as an input. Output is to the screen, or to image file (specified with figfile).
It is necessary to specify existing CASA image or FITS cube as an imagename. Otherwise, the task will fail. If figfile is specified, the profile map is saved as an PNG image. Please set overwrite to False if you don’t want to overwrite existing file.
Selection of data is enabled through polarisation only (since this task operates in image data, not measurement set format).
The plot parameters can be manipulated via plotrange, title, separatepanel, showaxislabel, showtick, figsize; the line style can be specified through linecolor, linestyle, linewidth, and the actual number of sub-plots is specificed with numpanels.
The number of panels along the horizontal and vertical direction can be specified via the parameter numpanels. It should be a string containing numerical values indicating the number of panels. If only one number is given it will be applied to both axes. If you want to provide different numbers to horizontal and vertical axes, you should give two numbers as a string separated by comma.
If the number of panels is less than the number of pixels of input image, more than one pixel is assigned to one panel. In that case, spectra to be shown are the average of the assigned spectra in each pixel.
Default value for numpanels is empty string (‘’) which corresponds to an auto calculation of the number of panels based on the number of pixels of input image. Formulas for the number of horizontal and vertical panels, nh and nv, are as follows:
npanel = min(max(nx, ny), 8)
step = (max(nx, ny) - 1) / npanel + 1
nh = nx / step + 1
nv = ny / step + 1
where nx and ny are the number of pixels along direction axes. In the above calculation, upper limit for nh and nv is 9.
The output image is directed to screen by default, but can be sent to a file image by naming a file with ‘figfile’. The image can also be made with a transparent background: transparent=True
The behaviour of the task in the context of masked data (i.e. how to show data that are masked) is enabled with plotmasked, which can have values;
'empty' (default; show empty panel)
'zero' (plot zero level)
'none' (show nothing)
'text' (show text indicating 'NO DATA')
'plot' (plot masked data with different color specified by maskedcolor)
- Examples
plotprofilemap chooses the size and number of subplots based on that specified by the user, though blank data in the set may produce unexpected results. The appearance of the blank data can be changed using the plotmasked function, as shown below.
The default case for the M100 CSV data:
plotprofilemap(imagename='M100_TP_CO_cube.spw3.image')
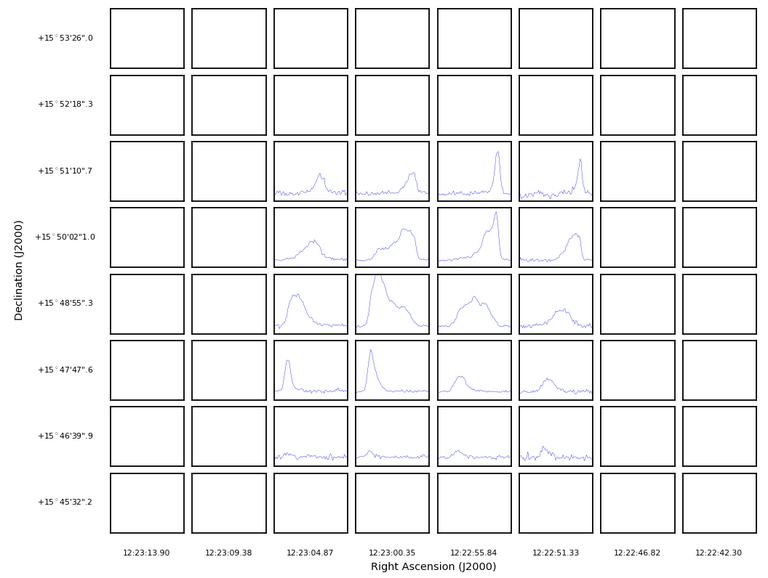
Obviously, the inner 4x5 region only, contains data that is not blanked. A naive solution is to select only those:
plotprofilemap(imagename='M100_TP_CO_cube.spw3.image',numpanels='4,5')
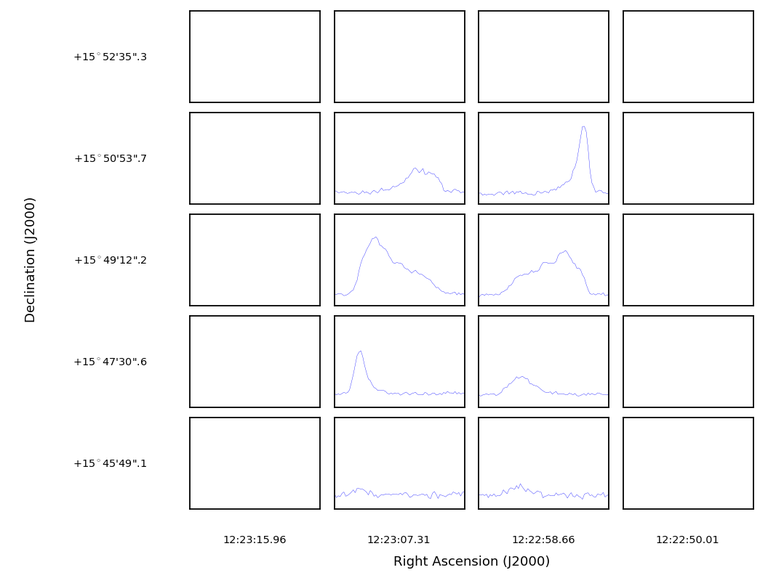
But the masked data still persists of course, and causes the outer-edges to be blanked. A solution is to set plotmasked=’none’:
plotprofilemap(imagename='M100_TP_CO_cube.spw3.image',plotmasked='none')
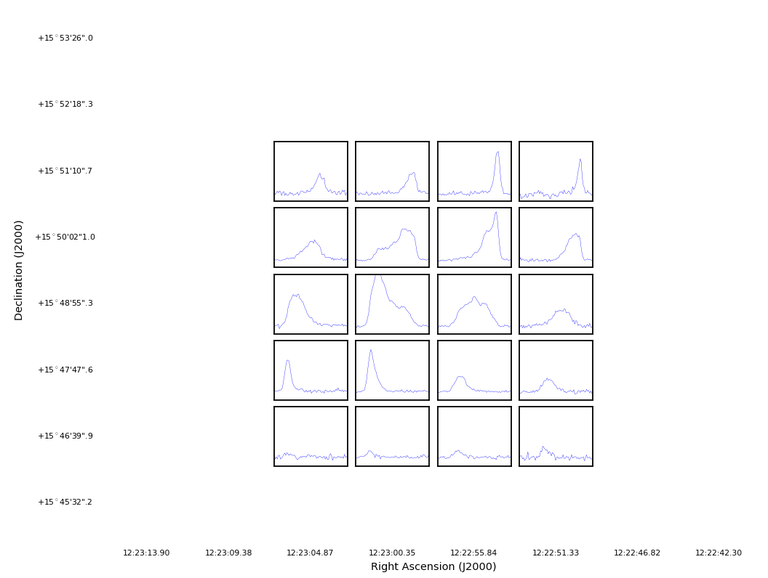
Which produces a plot that focuses only on the emission.
- Development
No additional development details
- Parameter Details
Detailed descriptions of each function parameter
imagename (path)- Input image name (CASA image or FITS)figfile (string='')- Output figure nameoverwrite (bool=False)- Overwrite existing figfiletransparent (bool=False)- Output transparent figurepol (int=0)- Polarization component to be plottedspectralaxis (string='')- Type of spectral axisrestfreq (string='')- Rest frequencyplotrange (string='')- Spectral axis range to plottitle (string='')- Title of the plotlinecolor (string='b')- Line colorlinestyle (string='-')- Line stylelinewidth (double=0.2)- Line width in pointsseparatepanel (bool=True)- Separate plotsplotmasked (string='empty')- Masked data handlingmaskedcolor (string='gray')- Line color for masked datashowaxislabel (bool=False)- Show axis labels on the bottom left panelshowtick (bool=False)- Show axis ticksshowticklabel (bool=False)- Show axis tick labels on the bottom left panelfigsize (string='')- Size of the figurenumpanels (string='')- Number of panels